
Article
Diversity Hiring Metrics for HR Teams: Measure & Act

Diversity Hiring Metrics for HR Teams: Measure & Act
TL;DR:
- Diversity hiring metrics quantify how well an organization attracts, selects, and retains underrepresented groups across the hiring process. Tracking five core metrics—such as applicant representation and stage conversion rates—helps identify barriers and improve equity, retention, and employer branding. Implementing these measures with clear ownership and regular review drives meaningful progress in diversity and inclusion efforts.
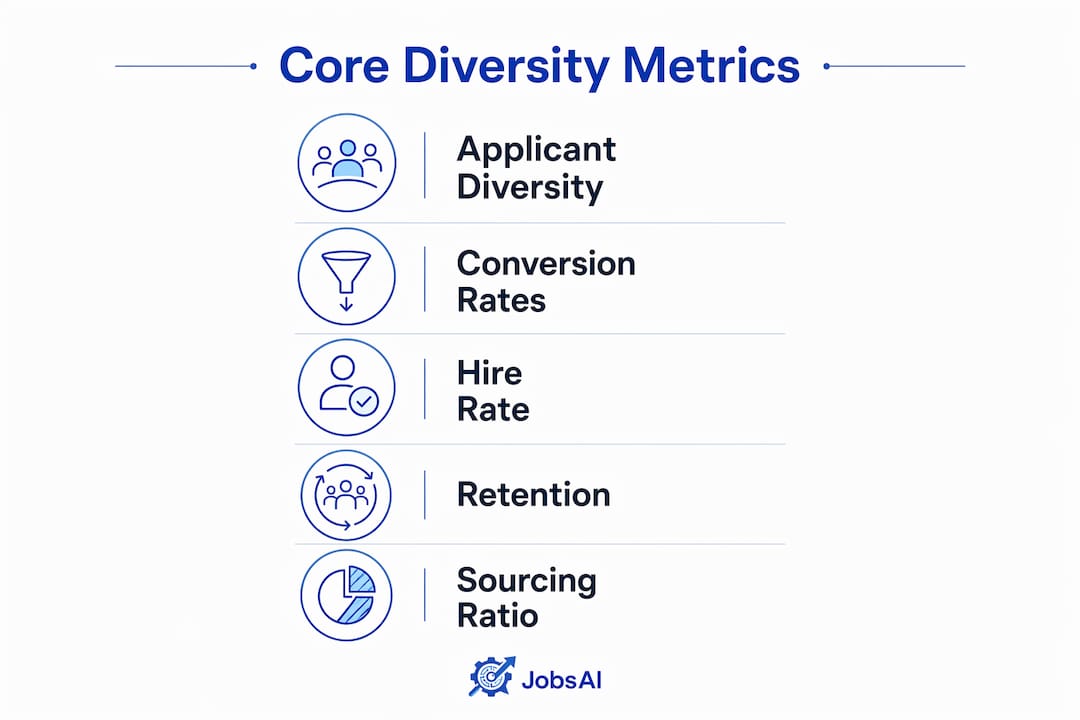
A diversity hiring metric is a quantitative measure that tracks how well your organization attracts, selects, and retains candidates from underrepresented groups across every stage of the hiring funnel—from sourcing through promotion. If you’re short on time, these are the five metrics to start with:
- Applicant-pool diversity: the share of applicants from each demographic group relative to the available labor market
- Stage-to-stage conversion by demographic: the percentage of candidates from each group who advance from one funnel stage to the next
- Offer acceptance rate by group: whether candidates from specific demographics accept at lower rates, which often signals a candidate experience or compensation gap
- Hire rate by demographic: the proportion of hires from each group relative to applicants, revealing selection bias
- Retention by cohort: 90-day, 6-month, and 1-year retention broken down by demographic, showing whether inclusion holds after the offer letter
Together, these five measures connect fairness in the process to real business outcomes: lower turnover, stronger employer brand, and better diversity outcomes across the organization.
Pro Tip: If you can only act on one metric this quarter, make it stage-to-stage conversion by demographic. It pinpoints exactly where diverse candidates are dropping out, which makes it the fastest path to a targeted fix.
Table of Contents
- What exactly are diversity hiring metrics, and what do they cover?
- Why do diversity hiring metrics matter for your organization?
- Core diversity hiring metrics: formulas, data fields, and improvement actions
- How do you choose which metrics to track first?
- Data collection, privacy, and U.S. compliance
- How to interpret results and turn them into action plans
- How a talent OS supports measuring diversity hiring metrics
- Common pitfalls to avoid when measuring diversity hiring metrics
- Key Takeaways
- The gap between measuring diversity and actually changing it
- Authoritative sources to consult next
- FAQ
What exactly are diversity hiring metrics, and what do they cover?
A diversity hiring metric disaggregates a standard recruiting KPI by demographic group. A plain time-to-fill number tells you how fast you hire. The same number broken out by race/ethnicity or gender tells you whether speed is distributed equally across candidate groups. That disaggregation is the defining feature.
The scope runs the full talent lifecycle:
- Sourcing: which channels surface diverse candidates
- Application: who applies relative to the labor market
- Screening and interviews: who advances at each stage
- Offers and hires: who receives and accepts offers
- Retention and promotion: who stays and who advances
What this metric set excludes is equally important. General recruiting KPIs like cost-per-hire or time-to-fill are not diversity hiring metrics unless they are broken out by demographic. Engagement survey scores are inclusion metrics, not hiring metrics, though they complement this set.
Commonly tracked demographic dimensions in the U.S. include race/ethnicity, gender, disability status, veteran status, and age. Intersectionality matters: a woman of color may face compounding barriers that neither gender nor race data alone would surface. Track intersectional cuts when sample sizes allow.
Pro Tip: Switch from raw headcounts to rates when any single demographic group has fewer than 30 candidates in a stage. Below that threshold, a count of two or three people can swing a percentage wildly, making the data misleading. Use rates and flag small samples explicitly in your dashboard.
Why do diversity hiring metrics matter for your organization?
The business case is concrete. Companies in the top quartile for ethnic diversity were 39% more likely to outperform financially than peers in the bottom quartile. That correlation doesn’t prove causation, but it’s consistent enough across markets and years that boards and CHROs treat it as a real signal worth managing.

Retention is the other lever. When bias increases turnover likelihood for affected groups, the cost compounds: recruiting fees, lost productivity, and institutional knowledge walking out the door. Tracking retention by cohort surfaces those patterns before they become expensive.
Employer brand is a third driver. A significant share of job seekers factor workforce diversity into their employer decisions, which means your diversity metrics are also a talent-market signal. Candidates research this before they apply.
From a compliance standpoint, the EEOC and OFCCP both require federal contractors to analyze workforce representation and flag adverse impact. Maintaining clean, disaggregated hiring data means you’re audit-ready rather than scrambling to reconstruct records when a complaint arrives.
The stakeholders who rely on these numbers span the organization:
- CHRO and DEI leaders: strategic goal-setting and board reporting
- TA leaders and recruiters: funnel optimization and sourcing decisions
- Legal and compliance: EEOC/OFCCP readiness and adverse-impact monitoring
- Compensation teams: pay-equity analysis at offer and promotion
Core diversity hiring metrics: formulas, data fields, and improvement actions
The table below covers the ten metrics most HR teams need. For each one, the formula uses only data fields your ATS and HRIS already collect or can collect with minor configuration.
| Metric | Formula | Required data fields | What it reveals | Improvement actions |
|---|---|---|---|---|
| Candidate representation (top of funnel) | (Applicants from group ÷ total applicants) × 100 | Requisition ID, applicant demographic flag, application date | Whether your sourcing reaches diverse talent pools | Expand to HBCUs, professional associations, diverse job boards |
| Diversity sourcing ratio | (Diverse candidates sourced ÷ total candidates sourced) × 100 | Source channel tag, demographic flag, sourcing date | Which channels produce diverse pipelines; where to reallocate spend | Audit channel ROI by demographic; cut low-performing sources |
| Stage-to-stage conversion by demographic | (Candidates from group advancing ÷ candidates from group entering stage) × 100, per stage | Funnel stage timestamps, demographic flag, disposition code | Where bias shows up in screening and interviews | Structured interviews, calibrated scorecards, blind resume review |
| Interview-to-offer and offer acceptance rate | (Offers extended to group ÷ interviews with group) × 100; (Offers accepted ÷ offers extended) × 100 | Interview status, offer status, demographic flag | Selection bias at final stage; candidate experience gaps | Diverse-slate policies, compensation transparency, recruiter debrief audits |
| Hire rate by demographic | (Hires from group ÷ applicants from group) × 100 | Hire date, demographic flag, requisition ID | Overall selection equity; adverse impact screening | Apply the four-fifths rule (ratio ≥ 0.80) as a triage threshold |
| Retention by cohort | (Employees from group still employed at N days ÷ hires from group) × 100 | Hire date, termination date, termination reason, demographic flag | Post-hire inclusion; cultural or systemic barriers | Stay interviews, onboarding equity audits, manager training |
| Promotion rate by demographic | (Promotions for group ÷ eligible employees in group) × 100 | Promotion date, eligibility flag, demographic flag | Whether advancement is equitable | Transparent criteria, sponsorship programs, calibration sessions |
| Pay equity at offer | Median offer salary for group ÷ median offer salary for reference group | Offer amount, role level, demographic flag | Compensation bias at the point of hire | Salary bands, structured offer approval, compensation audits |
| Candidate experience by demographic | Mean survey score for group vs. overall mean | Post-process survey responses, demographic flag | Whether process feels fair across groups | Targeted follow-up surveys, process redesign for identified gaps |
| Workforce diversity index | (Employees from each group ÷ total employees) × 100, by level | HRIS headcount, demographic flag, job level | Representation across levels and functions | Goal-setting by level, pipeline investment, succession planning |
A few metrics deserve extra attention. The diversity sourcing ratio is often the earliest determinant of downstream hiring diversity. If your sourcing ratio is low, every downstream metric will suffer regardless of how fair your interviews are. Fix the top of the funnel first.
On diverse slates: Mercer-cited research shows that having two diverse candidates on a finalist slate substantially increases the likelihood of a diverse hire. A diverse-slate compliance metric, tracking what percentage of requisitions met a defined slate standard, turns that finding into a measurable process control.
Pro Tip: For structured interviews, pair the stage-to-stage conversion metric with interviewer scorecards. When you can see which interviewers consistently score candidates from specific groups lower, you have a coaching conversation grounded in data, not opinion.
How do you choose which metrics to track first?
Not every team can measure all ten metrics on day one. Use these five criteria to prioritize:
- Strategic alignment: does this metric connect to a goal your CHRO or board has already committed to?
- Data availability: can your ATS or HRIS produce the required fields today, or does it require a configuration project?
- Ability to act: if the metric shows a gap, does your team have the authority and tools to fix it?
- Legal risk: does a gap here create EEOC or OFCCP exposure?
- Expected impact: is this stage high-volume enough that a small improvement moves the overall hire rate?
A practical starting sprint for most teams: applicant-pool diversity, stage-to-stage conversion, hire rate by demographic, retention at 90 days, and pay equity at offer. These five cover the funnel from entry to compensation and give you enough signal to prioritize remediation without overwhelming your analytics capacity. For broader context on how these fit into your overall recruiting KPIs, it helps to see them alongside standard efficiency metrics.
Dashboard structure and reporting cadence

Your dashboard should have two layers. The top-line view shows current-period rates for each priority metric against a target or prior-period baseline. The drill-down view breaks each metric by department, requisition, recruiter, and demographic group.
Recommended cadence by audience:
- TA operations team: weekly funnel snapshots, especially conversion rates and sourcing ratios
- CHRO and DEI leaders: monthly dashboard review with trend lines and flagged anomalies
- Board or executive committee: quarterly summary linking representation and retention metrics to business outcomes
Ownership matters as much as cadence. Assign one person to own data collection, one to own analysis and reporting, and one to own remediation actions for each metric. Without named owners, dashboards become reports nobody acts on.
Data collection, privacy, and U.S. compliance
Demographic data collection in the U.S. operates under a clear principle: voluntary, separate, and purposeful. The EEOC’s EEO-1 reporting framework provides the baseline categories for race/ethnicity and gender. For federal contractors, OFCCP regulations add disability status and veteran status to the required set.
Self-identification should always be voluntary. Here is sample language your team can adapt:
Checklist for data storage and access:
- Store demographic flags in a separate table or field from the hiring decision record
- Restrict analyst access to aggregated, anonymized exports; hiring managers should not see individual demographic flags
- Set a data retention limit aligned with your legal hold policy (commonly three to five years for hiring records)
- Document your data minimization approach: collect only the fields you will actually analyze
- Audit access logs quarterly
Pro Tip: Low self-ID participation rates, often below 60%, don’t mean your data is useless. They do mean you should weight your analysis carefully and report the participation rate alongside your findings. To increase voluntary disclosure, communicate the purpose clearly, show employees how the data has been used to make process changes, and have senior leaders visibly participate.
How to interpret results and turn them into action plans
Reading a diversity metric in isolation rarely tells you what to do. The pattern across the funnel is what matters.
A common signature: strong applicant-pool diversity, but a sharp drop at the resume screening stage. That pattern points to screening criteria or tools that are filtering out qualified candidates from underrepresented groups, not a sourcing problem. A different signature, good screening conversion but low offer acceptance among women, points to a compensation or candidate experience issue, not a bias in selection.
Using the four-fifths rule as a triage tool
The adverse impact ratio compares the selection rate of a protected group to the selection rate of the highest-selected group. A ratio below 0.80 (the four-fifths threshold) flags potential adverse impact and warrants investigation. Use it as a triage tool, not a legal conclusion. When sample sizes are small, a ratio below 0.80 may be statistical noise; when samples are large, even a ratio of 0.82 may be practically significant.
Action-plan template
- Diagnose: identify which metric and which stage shows a gap
- Root cause: determine whether the gap is sourcing, screening criteria, interviewer behavior, compensation, or post-hire culture
- Targeted intervention: match the fix to the cause (sourcing partners, shortlisting practices, structured interviews, salary bands, retention programs)
- Measure effect: re-run the metric after one full hiring cycle to assess whether the intervention moved the number
- Assign owners and timelines: every action needs a named person and a due date
Pro Tip: When your sample for a specific demographic group is fewer than 30 in a given period, don’t report a rate as if it’s reliable. Combine cohorts across quarters, or use a rolling 12-month window, before drawing conclusions. Reporting a volatile rate as a trend misleads leadership and can trigger interventions in the wrong place.
How a talent OS supports measuring diversity hiring metrics
The mechanics of measurement depend on clean data flowing from the right systems. Here’s how the data model typically works in practice.
Where raw fields live:
- ATS: sourcing channel tags, funnel stage timestamps, disposition codes, requisition IDs, interview scorecards
- Self-ID module: demographic flags stored separately from the hiring record, linked by candidate ID
- Offer and HRIS systems: offer amount, hire date, job level, termination date, termination reason, promotion date
Automated checks that reduce manual work:
- Diverse-slate alerts that flag a requisition when it reaches the finalist stage without meeting the slate standard
- Stage-to-stage disparity alerts that trigger when conversion rates diverge by more than a set threshold between demographic groups
- Pay-equity triggers that flag offers outside the approved band for a role level before the offer is extended
- Scheduled demographic roll-ups that push anonymized exports to the analytics team on a set cadence
Jobsai Enterprise’s workflow automation and candidate pool features are designed to support exactly this kind of structured data capture and alert logic, so your team spends time acting on insights rather than assembling spreadsheets. Teams evaluating a talent OS for DEI measurement should look for configurable demographic tagging, role-based access controls on sensitive fields, and built-in reporting that disaggregates standard funnel metrics by group.
Pro Tip: Before you configure any automation, audit your existing ATS fields for data quality. A sourcing channel tag that says “other” for 40% of candidates makes your sourcing ratio meaningless. Clean field taxonomy first, then build the dashboard.
Common pitfalls to avoid when measuring diversity hiring metrics
Even well-intentioned measurement programs produce misleading results when the methodology is off. These are the mistakes we see most often.
- Reporting raw headcounts instead of rates. A team that hired 10 women out of 12 female applicants is doing better than one that hired 40 women out of 200. Headcounts without denominators hide the real story.
- Ignoring small-sample volatility. A single hire or rejection can swing a rate by 20 percentage points when the group has only five candidates. Flag small samples and use rolling windows.
- Conflating self-ID participation rates with representation. If 40% of your candidates didn’t self-identify, your demographic breakdown reflects only the 60% who did. Report participation rates alongside representation figures.
- Measuring hiring without measuring retention. A team that hits its diverse-hire target but loses those employees within a year has solved nothing. Pair hiring metrics with 90-day and 12-month retention by cohort.
- Metric-driven gaming. When hiring managers know they’re being measured on diverse-slate compliance, some will add token candidates to a slate they’ve already decided on. Pair compliance metrics with outcome metrics (hire rate, retention) to detect gaming.
- Unvetted AI screening tools. Automated screening can encode historical bias if the training data reflects past discriminatory patterns. Audit any AI screening tool for proxy variables (zip code, school name, employment gap) that correlate with protected characteristics.
- Proxy variable bias. Even without AI, requiring a specific degree from a specific tier of school, or penalizing employment gaps, can produce adverse impact without any intent to discriminate. Audit job requirements against actual performance predictors.
The remedy for most of these pitfalls is the same: use rates, set minimum sample thresholds before reporting, pair quantitative metrics with candidate experience surveys, and audit your tools and criteria on a defined schedule.
Key Takeaways
Diversity hiring metrics work only when each one is tied to a specific decision, a named owner, and a remediation loop that closes after one hiring cycle.
| Point | Details |
|---|---|
| Start with five core metrics | Applicant-pool diversity, stage-to-stage conversion, hire rate, retention by cohort, and pay equity at offer cover the full funnel. |
| Use rates, not headcounts | Always divide by the eligible pool; raw counts hide selection equity and mislead leadership. |
| Apply the four-fifths rule as a triage tool | An adverse impact ratio below 0.80 flags a stage for investigation, not a legal conclusion. |
| Collect self-ID data voluntarily and separately | Store demographic flags apart from hiring decisions and restrict access to anonymized, aggregated exports. |
| Pair every metric with an owner and a timeline | Measurement without named accountability produces dashboards nobody acts on. |
The gap between measuring diversity and actually changing it
Most organizations that struggle with DEI measurement aren’t failing at data collection. They’re failing at the step between the dashboard and the decision. A metric that shows a 0.65 adverse impact ratio at the screening stage is only useful if someone with authority over screening criteria sees it, believes it, and has a concrete next step to act on.
The measurement programs that actually move numbers share a few traits. They report to someone with budget authority, not just visibility. They connect each metric to a specific process decision, which sourcing channels to fund, which interview training to require, which compensation bands to enforce. And they measure the effect of each intervention after one full hiring cycle, not after three years.
The four-fifths rule is a useful triage tool, but it’s worth being honest about its limits. A ratio of 0.81 at a stage with 500 candidates is practically significant. A ratio of 0.72 at a stage with 12 candidates may be noise. Statistical significance and practical significance are different questions, and conflating them leads to either over-intervention or under-intervention.
The teams that get this right treat DEI metrics the way a finance team treats a budget variance: not as a verdict, but as a question that demands a root-cause answer and a corrective action with a deadline.
Authoritative sources to consult next
These resources provide the legal frameworks, research benchmarks, and practical guidance that underpin the measurement approach described above.
- EEOC EEO-1 Component 1 Data: The official source for workforce demographic reporting categories used by federal contractors and large employers. Use it to align your demographic taxonomy with the standard U.S. framework.
- SHRM Inclusion and Diversity Resources: SHRM’s topic hub covers DEI measurement, legal compliance, and practitioner tools. Useful for policy templates and benchmarking guidance.
- Rebooting Representation Report (Reboot Representation): Research on representation gaps in tech and corporate roles, with data on pipeline and retention patterns. Useful for benchmarking against industry-specific figures.
- Gem: Measuring Diversity in Hiring: A practitioner-focused breakdown of how to structure funnel analytics for DEI, with guidance on data sources and visualization.
- Recruitee: 6 Diversity Metrics You Should Be Measuring: A concise overview of core metrics with practical measurement guidance, useful as a quick-reference checklist for TA teams.
FAQ
What is a diversity hiring metric?
A diversity hiring metric is a quantitative measure that disaggregates a standard recruiting KPI by demographic group, tracking representation and equity from sourcing through retention and promotion.
What are the most important diversity metrics in HR?
The highest-priority metrics are applicant-pool diversity, stage-to-stage conversion by demographic, hire rate by group, retention by cohort, and pay equity at offer. These five cover the full hiring funnel and surface the most common sources of inequity.
Is diversity hiring good or bad for organizations?
Companies in the top quartile for ethnic diversity were 39% more likely to outperform financially than bottom-quartile peers, and diverse teams consistently show stronger retention and problem-solving outcomes. The evidence supports structured diversity hiring as a net positive for organizational performance.
What is the four-fifths rule in diversity hiring?
The four-fifths rule is a U.S. screening threshold: if the selection rate for a protected group is substantially lower than the rate for the highest-selected group, that gap warrants an adverse impact investigation. It’s a triage tool, not a legal finding.
How do you collect demographic data legally in the U.S.?
Self-identification must be voluntary, clearly purposed, and stored separately from hiring decision records. The EEOC’s EEO-1 framework defines the standard demographic categories; access to individual-level data should be restricted to analysts working with anonymized exports.
This article is general information for HR professionals and does not constitute legal advice. Confirm current EEOC and OFCCP requirements with your legal counsel or the relevant agency directly.
Recommended
See it in your workflow
JobsAI Enterprise runs sourcing, AI screening, and the whole interview pipeline in one place. Book a walkthrough tailored to your team.
Book a demo