
Article
Recruiter Productivity Metric: A 2026 Guide for Hiring Teams

Recruiter Productivity Metric: A 2026 Guide for Hiring Teams
TL;DR:
- The recruiter productivity metric measures qualified candidate submissions per working day to assess output. Benchmarks vary by role, with high performers submitting 8–15 for mid-level roles and 3–6 for senior positions weekly. Improving productivity involves automating tasks, standardizing processes, and tracking outcome-related metrics alongside submission counts.
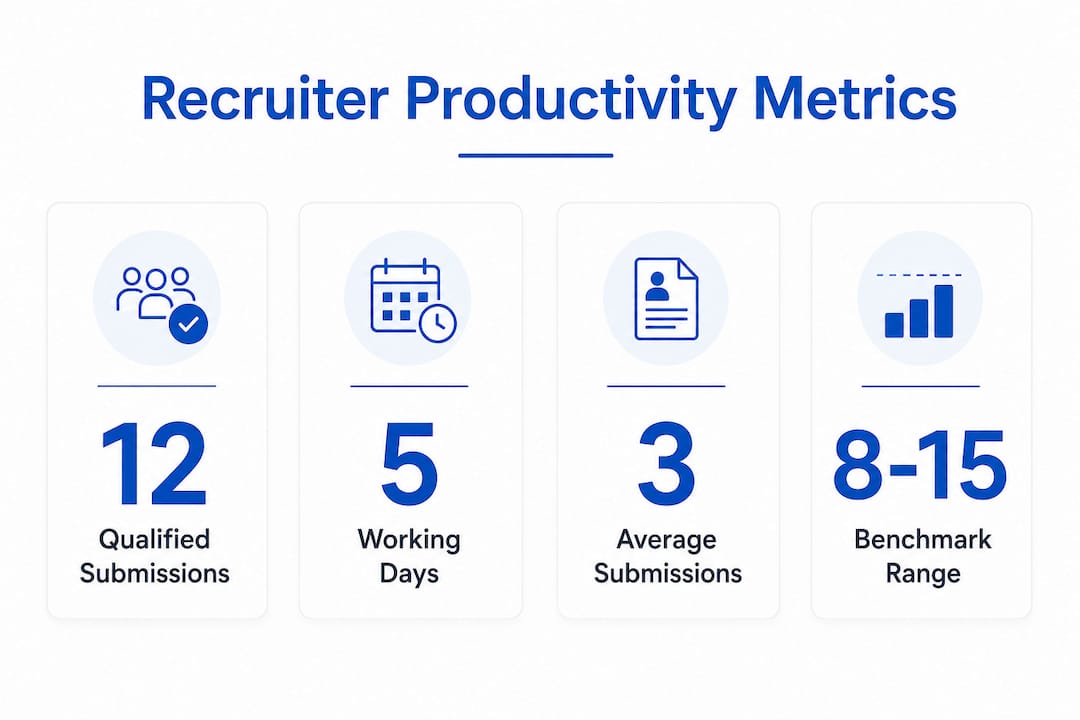
A recruiter productivity metric is defined as the number of qualified candidate submissions a recruiter completes within a set period, measured as total submissions divided by working days. This is the industry’s standard formula for quantifying output: Recruiter Productivity Score = Total Submissions Completed / Working Days in Period. The metric tells hiring managers how much real work their team produces, not just how busy recruiters appear. High-performing agency recruiters submit 8–15 qualified CVs per week for mid-volume roles, and 3–6 per week for senior or specialized positions. Knowing where your team stands against those benchmarks is the first step toward managing workload and improving hiring outcomes.
What is recruiter productivity metric and how is it calculated?

The recruiter productivity metric captures output, not effort. A recruiter who spends 50 hours a week on calls but submits two qualified CVs has low productivity by this measure. The formula is direct: divide total qualified submissions by the number of working days in the period you are measuring.
Getting the calculation right requires a clear definition of what counts as a submission. A valid submission is a client-ready, properly formatted CV that meets the role’s minimum requirements. Submissions that are incomplete, unformatted, or clearly outside the job brief do not count. Counting low-quality CVs inflates the score and defeats the purpose of the metric.
Follow these steps to calculate it correctly:
- Define the period. Choose a consistent window, such as one week or one calendar month. Consistency matters because switching periods mid-review makes comparisons meaningless.
- Count only qualified submissions. Pull the number of CVs submitted to clients or hiring managers that met the agreed brief. Exclude duplicates and resubmissions of the same candidate.
- Divide by working days. Use actual working days in the period, not calendar days. Account for public holidays and approved leave.
- Segment by role type. A recruiter filling entry-level warehouse roles will always score higher than one placing C-suite executives. Segment your data by seniority or function before drawing comparisons.
- Review data sources. Pull submission counts directly from your applicant tracking system or recruiting CRM to avoid manual counting errors.
Pro Tip: Track productivity weekly rather than monthly. Weekly data catches dips early, before they compound into a missed quarter.
A common mistake is pulling submission counts from email threads or spreadsheets instead of a centralized system. Manual data collection introduces errors and makes it nearly impossible to audit the numbers later.
What do recruiter productivity benchmarks actually mean?
Numbers only matter in context. Benchmarks for mid-volume agency recruiters sit at 8–15 qualified submissions per week. For senior or specialized roles, 3–6 per week is the accepted standard. These ranges reflect the reality that complex roles require deeper research, longer candidate conversations, and more thorough vetting.
| Role type | Typical weekly submissions | What a low score may indicate |
|---|---|---|
| Entry-level or high-volume | 12–20 | Process bottleneck or sourcing gap |
| Mid-level professional | 8–15 | Workload imbalance or unclear brief |
| Senior or specialized | 3–6 | Appropriate depth of search |
| Executive or niche | 1–3 | Normal for the complexity involved |
Productivity data also reveals workload distribution across a team. Recruiter productivity reveals workload balance and capacity, helping managers spot overloaded or underperforming team members. A recruiter consistently at the top of the range may be stretched too thin. One consistently below it may need coaching or a clearer brief.
The most important thing to watch is the relationship between volume and quality. High volume with low offer acceptance rates signals a speed-over-substance issue. A recruiter submitting 20 CVs a week but closing zero offers is not productive. They are generating noise.
Key signals to watch alongside raw submission counts:
- Offer acceptance rate. A drop here while submissions stay high points to quality problems.
- Client feedback scores. Clients who consistently reject submissions are signaling a brief mismatch.
- Time-to-fill by recruiter. Productivity should correlate with faster fills, not just more CVs sent.
- First-year retention. Hires who leave within 12 months often trace back to rushed submissions.
Pro Tip: Set a floor, not just a ceiling. Define the minimum acceptable submission rate for each role type so recruiters know the baseline expectation, not just the aspirational target.
How can recruiters and hiring managers improve productive output?
The fastest way to increase productive output is to remove the tasks that consume time without adding value. Automating repetitive tasks like CV formatting is the most direct path to higher output without adding hours. A recruiter who spends 90 minutes a day reformatting resumes loses nearly a full day of productive work each week.
Practical steps that move the needle:
- Automate CV formatting. Use your platform’s formatting tools so recruiters submit clean, consistent CVs without manual editing.
- Standardize intake briefs. A clear, detailed job brief at the start of a search reduces the back-and-forth that kills submission speed. Recruiters who spend less time clarifying requirements spend more time sourcing.
- Use structured screening criteria. Define the three to five non-negotiable requirements for each role before sourcing begins. This cuts the time spent reviewing candidates who will never pass the brief.
- Batch similar tasks. Grouping sourcing, outreach, and screening into dedicated time blocks reduces context-switching and improves daily output.
- Review candidate engagement tracking data. Knowing which candidates are actively responding lets recruiters prioritize outreach and avoid chasing cold leads.
Training matters as much as technology. Coaching recruiters on how to qualify candidates faster, write sharper outreach messages, and manage their pipeline reduces wasted effort at every stage. Productivity coaching works best when it is grounded in actual data from the recruiter’s own numbers, not generic advice.
The risk to avoid is pushing volume at the expense of quality. Incentivizing raw submission counts without pairing them with quality metrics creates a culture where recruiters send more CVs to hit a number, not to fill a role well.
How does recruiter productivity fit into the broader recruitment performance framework?
Recruiter productivity is an activity metric, not an outcome metric. It measures what a recruiter does, not what results from that work. Recruiting metrics measure efficiency, quality, and candidate experience, with quality of hire viewed as the most important metric overall. Productivity supports quality of hire but does not replace it.
The distinction between activity metrics and outcome metrics matters for how you report to leadership. Activity metrics like submissions per week show effort and capacity. Outcome metrics like quality of hire, offer acceptance rate, and first-year retention show business impact. Both categories belong in a complete performance picture.
Tracking 5–7 metrics that connect directly to business outcomes is more effective than monitoring dozens of data points. A focused scorecard keeps teams clear on what matters and prevents the reporting burden from consuming the time recruiters should spend recruiting.
The metrics that pair most naturally with recruiter productivity are:
- Quality of hire. Measures whether the people placed actually perform well.
- Offer acceptance rate. Reflects how well submissions match candidate expectations and client needs.
- Time-to-fill. Shows whether high productivity translates into faster hiring.
- First-year retention. The ultimate test of whether the right person was placed in the right role.
Effective recruitment analytics go beyond reporting what happened. They ask why it happened and what to do next. A team that reviews productivity data and then acts on it, whether by redistributing workload, adjusting briefs, or adding automation, gets more value from the metric than one that simply tracks the number.
Aligning productivity data with business outcomes also strengthens the talent acquisition team’s position when justifying budget or headcount. When you can show that a recruiter producing 12 qualified submissions per week generates a measurable fill rate and retention outcome, the conversation with leadership becomes concrete rather than abstract. You can also reference US staffing industry benchmarks to contextualize your team’s numbers against the broader market.
Key Takeaways
Recruiter productivity metric measures qualified submissions per working day, and it only delivers value when paired with quality indicators like offer acceptance rate and first-year retention.
| Point | Details |
|---|---|
| Core formula | Divide total qualified submissions by working days in the period. |
| Role-based benchmarks | Mid-volume roles: 8–15 per week; senior roles: 3–6 per week. |
| Quality check | High submission volume with low offer acceptance signals a quality problem. |
| Focused scorecard | Track 5–7 outcome-linked metrics rather than dozens of activity counts. |
| Automation impact | Automating CV formatting and screening frees recruiter time for higher-value work. |
The metric tells you what, not why
I have worked with recruiting teams that treated submission counts as the whole story. The number goes up, everyone feels good. The number goes down, someone gets a performance review. That approach misses the point entirely.
The recruiter productivity metric is a diagnostic tool, not a report card. When I see a recruiter’s output drop, my first question is not “why aren’t you hitting your number?” It’s “what changed in your pipeline?” A sudden dip often traces back to a poorly written job brief, a client who keeps moving the goalposts, or a sourcing channel that dried up. None of those are recruiter failures.
The teams I have seen use this metric well share one habit: they review productivity data together, not in isolation. A weekly 15-minute team check-in where everyone shares their numbers and flags blockers does more for output than any individual coaching session. Transparency removes the anxiety around the metric and turns it into a shared problem-solving tool.
The other thing I would push back on is the instinct to set the same productivity target for every recruiter. A senior recruiter filling niche technical roles should not be measured against the same submission rate as someone filling high-volume customer service positions. Benchmarks exist for a reason. Use the role-type segmentation, and you will get a much more honest picture of who is actually performing.
Technology helps, but only if you use it to give recruiters more time for the work that requires judgment. Automating formatting and screening is the right call. Using dashboards to micromanage hourly output is not.
— Hippolyte A.
How Jobsai Enterprise supports recruiter productivity tracking
Jobsai Enterprise is an AI-powered talent acquisition platform built for recruiting agencies and hiring teams that need to manage candidates faster without adding manual work.
The platform handles AI-powered candidate screening automatically, ranking applicants against job requirements so recruiters spend less time reviewing unqualified CVs and more time on submissions that count. The candidate database and talent pools feature keeps your pipeline organized and searchable, reducing the time lost to duplicate outreach and missed follow-ups. Productivity dashboards give managers a clear view of team output by role type, without requiring manual data pulls. If you want to see how it fits your team’s workflow, take the platform tour or visit the built-for page to see how Jobsai Enterprise is configured for your hiring context.
FAQ
What is a recruiter productivity metric?
A recruiter productivity metric measures the number of qualified candidate submissions a recruiter completes within a defined period. The standard formula is total qualified submissions divided by working days in the period.
What is a good recruiter productivity benchmark?
High-performing agency recruiters submit 8–15 qualified CVs per week for mid-volume roles and 3–6 per week for senior or specialized positions. Benchmarks vary by role type and seniority.
How do I improve recruiter productivity without lowering quality?
Automate repetitive tasks like CV formatting, standardize intake briefs, and use structured screening criteria. Pairing productivity targets with quality metrics like offer acceptance rate keeps output and quality aligned.
What other metrics should I track alongside recruiter productivity?
Tracking 5–7 outcome-linked metrics is the most effective approach. Key complements include quality of hire, offer acceptance rate, time-to-fill, and first-year retention.
Why does recruiter productivity vary by role type?
Complex or senior roles require deeper research, longer candidate conversations, and more thorough vetting. A recruiter filling executive positions will always produce fewer weekly submissions than one filling high-volume entry-level roles, and that difference is expected.
Recommended
See it in your workflow
JobsAI Enterprise runs sourcing, AI screening, and the whole interview pipeline in one place. Book a walkthrough tailored to your team.
Book a demo